The Waffle House Index The Unconventional, Critical Metric for Disaster Response in 2026
In the complex world of disaster analytics, one of the most trusted metrics isn’t generated by satellites or sophisticated sensors—it’s signaled by the glow of a familiar yellow sign. The Waffle House Index (WHI) remains a cornerstone of real-time impact assessment, offering government agencies, first responders, and residents an unvarnished, operational snapshot of a community’s health in the immediate aftermath of a storm. As we face increasingly volatile weather patterns in 2026, this index has evolved from a quirky anecdote into an indispensable disaster resilience benchmark.
Decoding the Index A Real-Time Barometer for Community Stability
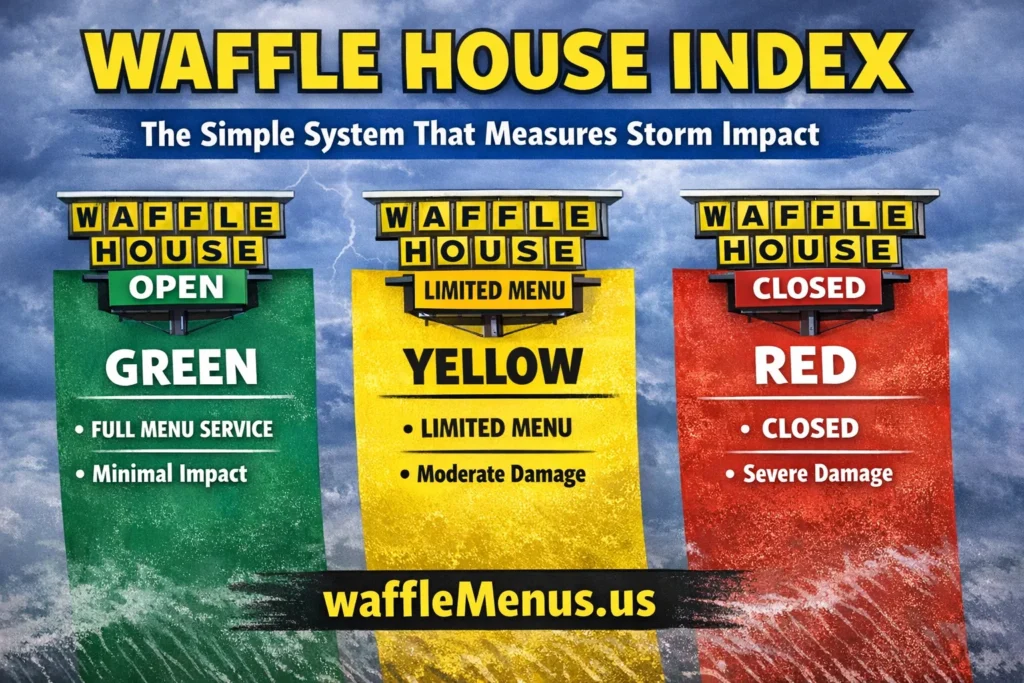
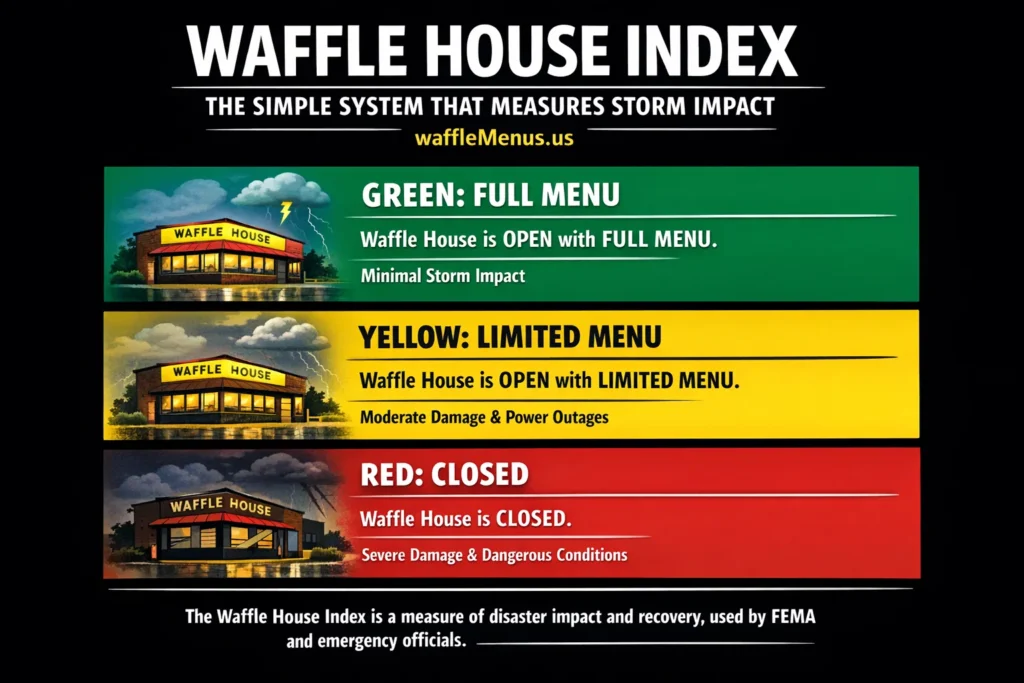
The Index is a tri-color status system used internally by Waffle House Index and shared publicly with agencies like FEMA (Federal Emergency Management Agency). Its power lies in its simplicity, translating complex infrastructure failures into actionable intelligence.
| Color | Status | What It Signals | Implication for Community Resilience |
|---|---|---|---|
| GREEN | Full Menu | Full power, intact supply chains, staff able to report. | Minimal disruption. Critical infrastructure is functional. Recovery focus: low. |
| YELLOW | Limited Menu | Intermittent power (generators in use), constrained supplies, logistical challenges. | Significant disruption. Community is coping but strained. Recovery is active. |
| RED | Closed | Severe damage, unsafe conditions, major infrastructure failure, or mandatory evacuation. | Critical disruption. Area is inaccessible or dangerously compromised. Priority for emergency response. |
A “Yellow” index is a critical early-warning signal, often preceding official reports of grid failure or supply chain disruption. It provides a granular, street-level view that satellite imagery cannot. This limited menu often reflects operational triage, where kitchens rely on a streamlined selection like the classic Waffle House All-Star Special or a simple Cheese Omelet that require fewer resources than the full Waffle House breakfast menu or elaborate hashbrown bowls.
Origins and Evolution: From Observation to Institutional Tool
The term was coined in 2004 by Craig Fugate, then Director of the Florida Division of Emergency Management and later FEMA Administrator. Fugate noticed the chain’s legendary operational resilience—if a Waffle House closed, it signaled catastrophic damage. This observation was formalized through collaboration with Waffle House’s crisis management team, including longtime executive Pat Warner.
By the 2024 hurricane season, the WHI had been integrated into FEMA’s internal Common Operating Picture (COP) dashboards, correlating it with data from the National Oceanic and Atmospheric Administration (NOAA) and power outage maps. It’s now cited in White House briefings and Department of Homeland Security (DHS) situational reports.
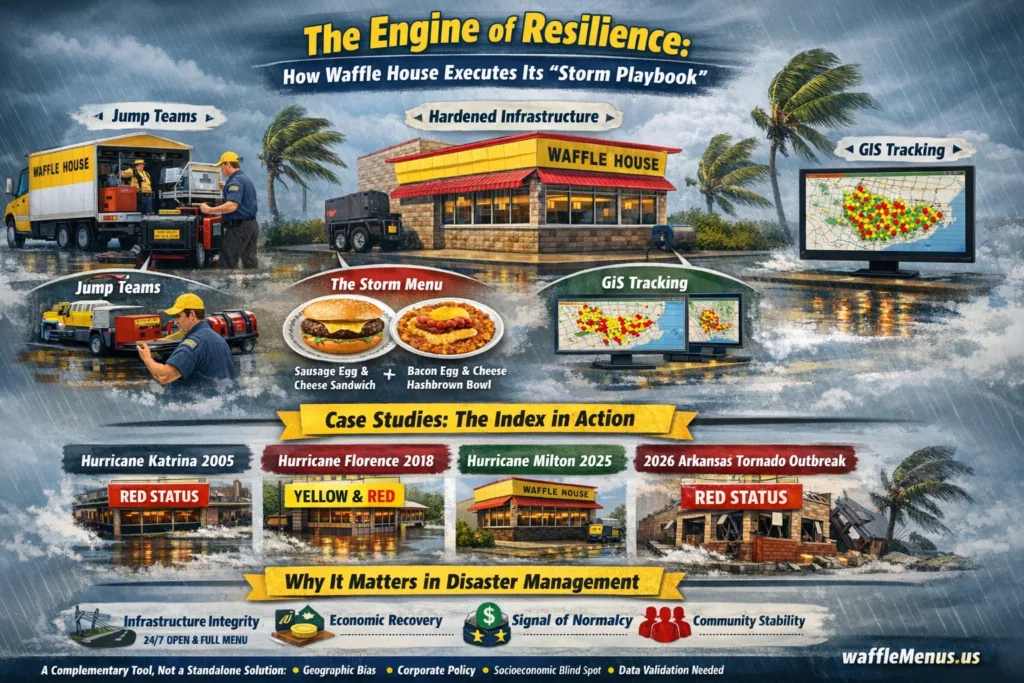
The Engine of Resilience: How Waffle House Index Executes Its “Storm Playbook”
Waffle House’s ability to serve as a reliable indicator is no accident. It’s the result of a militaristic Business Continuity and Disaster Recovery (BCDR) plan, refined over decades:
- Pre-Positioned “Jump Teams”: Comprised of trained associates from unaffected regions, these teams deploy with portable generators, fuel, and supplies ahead of landfall, ready to repair and reopen.
- Hardened Infrastructure: Many Waffle House locations in hurricane-prone zones have pre-wired generator hookups and storm shutters. The company maintains a private logistics network to bypass crippled public supply chains.
- The “Storm Menu”: A streamlined menu requiring less equipment and fewer ingredients conserves resources. This often means focusing on griddle-based items like the Sausage Egg and Cheese Sandwich or Bacon Egg and Cheese Hashbrown Bowl, rather than items that need fryers or a wider array of fresh supplies from the full Waffle House lunch and dinner menu.
- Real-Time GIS Tracking: The corporate command center tracks every store’s status—power source, menu level, staff availability—on a live geographic information system (GIS) map, data which is shared with emergency officials.
- Employee Support: The company ensures staff have access to secure transportation and lodging, recognizing that community recovery depends on its people.
Case Studies: The Index in Action During Historic Events
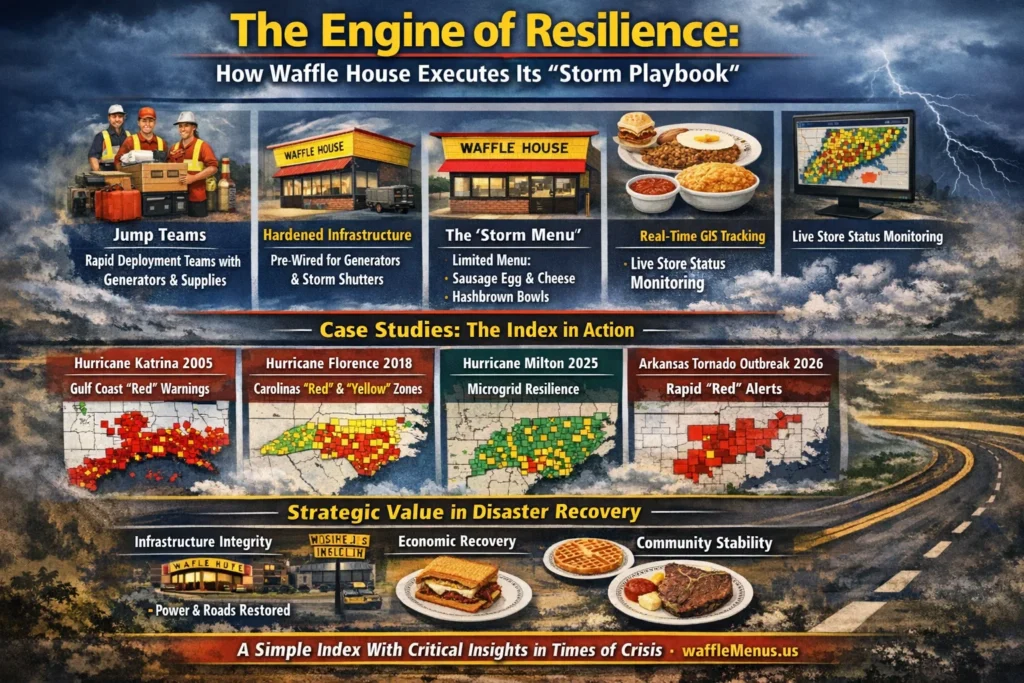
- Hurricane Katrina (2005): The massive “Red” cluster across Louisiana and Mississippi provided FEMA with an immediate, visceral understanding of the storm’s catastrophic footprint, long before formal damage assessments could begin.
- Hurricane Florence (2018): The patchwork of “Yellow” and “Red” indices across the Carolinas helped direct search and rescue (SAR) teams and US Army Corps of Engineers resources to the most isolated, flooded communities. A “Yellow” status here meant locations might only be serving basics like grits bowls and scrambled eggs.
- Hurricane Milton (2025): As a Category 4 storm, Milton tested next-gen resilience. Waffle House’s use of advanced microgrid generators and satellite communications allowed many locations to maintain a “Green” or “Yellow” status, offering vital hubs for first responders. Patrons might have noticed a temporary absence of specialty items like the Pecan Waffle or Pecan Pie, but core functionality remained.
- 2026 Arkansas Tornado Outbreak: Demonstrating its utility beyond hurricanes, the rapid transition to “Red” in specific towns provided clearer initial impact data than early radar reports, accelerating state emergency declarations.
Strategic Value: Why the Index Remains Critical in Modern Disaster Management
In 2026, amidst data overload, the WHI’s value is its tactical clarity. It serves as a proxy metric for several key recovery indicators:
- Infrastructure Integrity: A “Green” status implies functional roads, power, and cellular networks, meaning the local Waffle House hours are back to 24/7 and the full array of Waffle House sandwiches and beverages is available.
- Economic & Social Recovery: A reopening location signals returning normalcy, often encouraging other businesses to resume operations. The return of a Texas Bacon Patty Melt or Chicken Melt Hashbrown Bowl to the menu is a small but meaningful sign of supply chain restoration.
- Psychosocial Impact: For residents, an open Waffle House Index provides a profound sense of stability and community—a “return to normal.” Whether it’s a comforting classic waffle or a hearty T-Bone Steak, it’s a tangible sign of recovery.
It is frequently cross-referenced with IoT sensor data, social media sentiment analysis, and utility outage maps to validate AI-driven disaster models.
Limitations and Ethical Considerations
While powerful, the index has acknowledged limits:
- Geographic Bias: Its density is strongest in the Southeast U.S., offering less insight in regions with fewer locations, despite the presence of Waffle Houses in Texas and Waffle House in North Carolina being strong indicators.
- Corporate Policy Influence: Decisions to close can be based on corporate liability and employee safety, not solely on environmental damage.
- Socioeconomic Blind Spot: It doesn’t directly measure impact on vulnerable populations without access to these commercial hubs.
- Not a Standalone Tool: Emergency managers stress it is a complementary data point, not a replacement for engineering assessments or ground surveys.
The 2026 Perspective: Integration with Technology and Future Trends
Today, the WHI is part of a broader resilience intelligence ecosystem. Innovations include:
- Public WHI Tracker Maps: Some local news affiliates now embed live, anonymized WHI status maps on their websites during events.
- AI Correlation: Machine learning models are beginning to predict recovery timelines by analyzing the pace of WHI transitions from Red to Yellow to Green.
- “Gray” Status: Discussions are underway about adding a fourth status for locations operating solely as community aid stations, providing charging ports, water, and information even without full food service.
Practical Guidance for the Public
For citizens, the index is a straightforward tool for personal risk assessment:
- See a “Yellow” Index? Prepare for extended power outages. Conserve device batteries, and expect limited fuel and cash availability. The menu may be reduced to core items like hashbrowns, sausage, and bacon.
- See a “Red” Index? Heed official warnings. This confirms severe danger. Do not attempt to “check for yourself.”
- See a Return to “Green”? A strong signal that major roads are clear, utilities are restoring, and the immediate crisis is transitioning to recovery. You can likely enjoy the full Waffle House sides menu or a Build Your Own Hashbrown Bowl again.
Frequently Asked Questions (FAQs)
Is the Waffle House Index used for cyberattacks or other non-weather disasters?
Yes. Following the 2025 regional grid cyber-attack, FEMA noted correlations between prolonged power failure and Waffle House closures, demonstrating its utility in man-made disasters.
Are there efforts to create similar indices for other chains?
While “big-box” store openings are tracked, no chain matches Waffle House’s 24/7 culture, geographic density in high-risk zones, and public transparency. The chain’s unique Regulars Club culture and commitment to being open every day, even Christmas, make it the gold standard for private-sector disaster indicators.
How can I access real-time Waffle House Index data?
Official status is often relayed through FEMA’s social media channels and local emergency management apps during active incidents. The company does not run a public live map for security reasons.
Does the index consider nutritional or allergen information during disasters?
During a “Yellow” status, access to detailed Waffle House nutrition or allergen information may be limited. Those with specific dietary needs should exercise extra caution and preparation.
Conclusion
The Waffle House Index endures because it humanizes disaster data. In 2026, it represents the intersection of private-sector preparedness, public-private partnership, and community tenacity. That glowing yellow sign is more than a restaurant logo; it’s a beacon signaling whether a community is struggling, surviving, or starting to thrive again. It reminds us that in the face of disaster, the most meaningful metrics are often those that measure our shared capacity to endure, respond, and rebuild—whether over a plate of scattered, smothered, and covered hashbrowns or a simple cup of large coffee.
For more information on Waffle House’s standard operations and menus, visit our About Us page or review our Privacy Policy and Terms and Conditions.